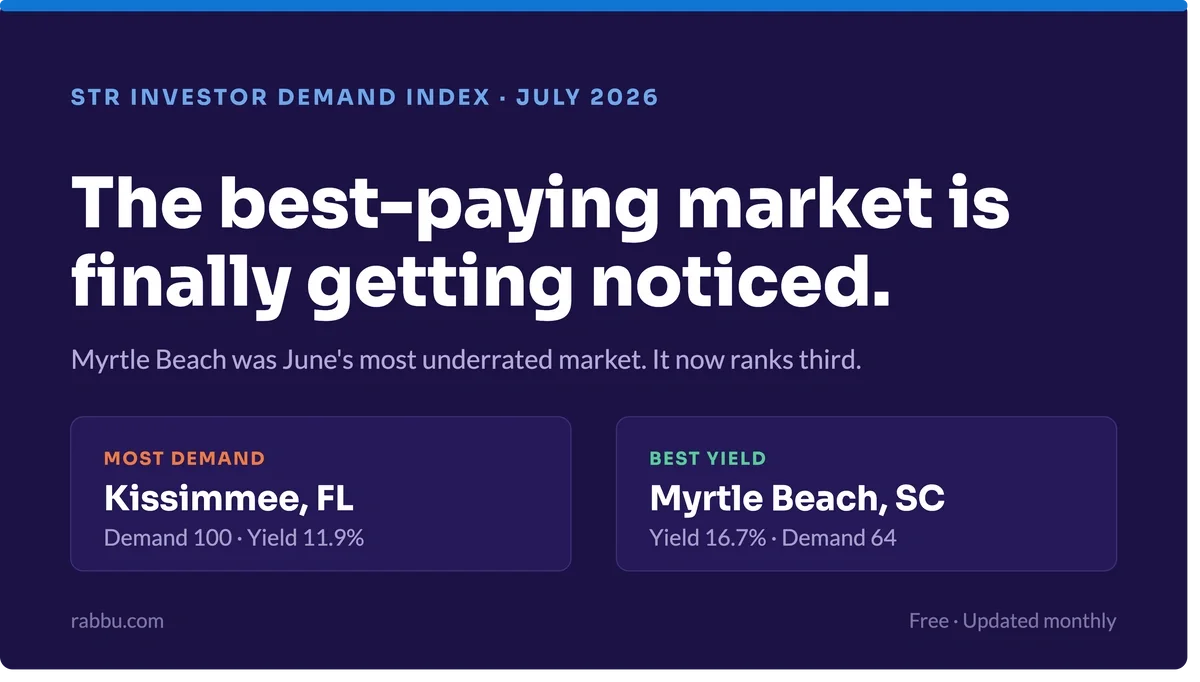
Rabbu's STR Investor Demand Index (STRIDI) tracks where short-term rental investors are actively looking to buy. In July, they searched hardest in Kissimmee, San Diego, and Myrtle Beach.
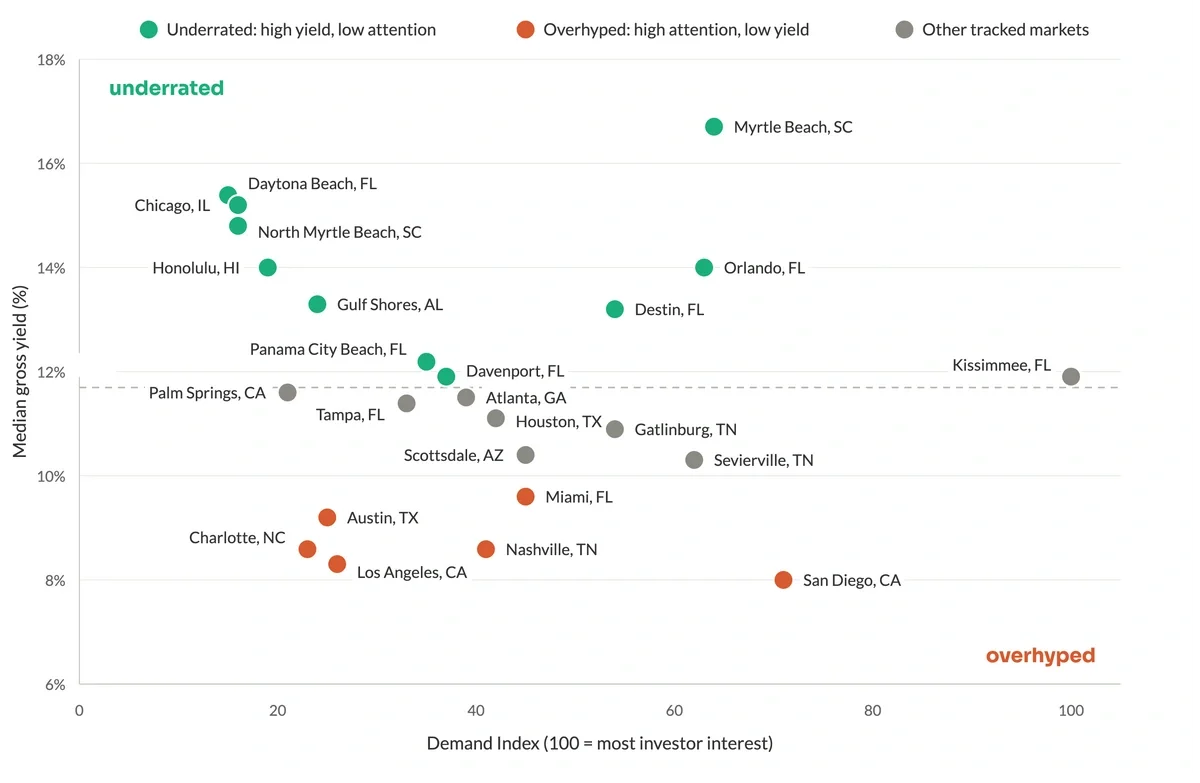
The pattern we found in June held again: the markets pulling the most buyer attention are rarely the ones paying the best returns. San Diego ranked second for investor interest while posting a median gross yield of 8.0%, the weakest figure in the top fifteen.
But July produced the first real exception, and it came from our own June report. Myrtle Beach was last month's most underrated market, holding the highest median yield in the country while ranking outside the top ten for attention. This month it ranks third for demand and still holds the highest yield at 16.7%. It is the only market in our data currently sitting at the top of both axes.
The most in-demand STR markets right now
The most in-demand short-term rental markets in June 2026 were Seattle, Kissimmee, and Fort Lauderdale, ranked from real buyer search and inquiry activity on Rabbu. Seattle led every U.S. market for investor interest, scoring 100 on the Rabbu Demand Index, the anonymized 0 to 100 scale that tracks where investors are actively looking to buy.
|
Rank |
Market |
Demand Index |
Median gross yield |
|
|---|---|---|---|---|
| 1 | Kissimmee, FL | 100 | 11.9% | −5% |
| 2 | San Diego, CA | 71 | 8.0% | +5% |
| 3 | Myrtle Beach, SC | 64 | 16.7% | +31% |
| 4 | Orlando, FL | 63 | 14.0% | +8% |
| 5 | Sevierville, TN | 62 | 10.3% | +32% |
| 6 | Gatlinburg, TN | 54 | 10.9% | −5% |
| 7 | Destin, FL | 54 | 13.2% | +8% |
| 8 | Scottsdale, AZ | 45 | 10.4% | −1% |
| 9 | Miami, FL | 45 | 9.6% | +9% |
| 10 | Houston, TX | 42 | 11.1% | −33% |
| 11 | Nashville, TN | 41 | 8.6% | −25% |
| 12 | Atlanta, GA | 39 | 11.5% | +81% |
| 13 | Davenport, FL | 37 | 11.9% | −38% |
| 14 | Panama City Beach, FL | 35 | 12.2% | −21% |
| 15 | Tampa, FL | 33 | 11.4% | −34% |
Kissimmee has now held a top-two position in both months we have published. The Orlando cluster as a whole, meaning Kissimmee, Orlando, and Davenport together, continues to draw more combined investor attention than any other region in the country, which is consistent with it being the one large market where vacation rental zoning is broadly permissive rather than contested.
The most underrated markets
Daytona Beach was the most underrated short-term rental market in July 2026, delivering a 15.4% median gross yield while scoring just 15 on the STR Investor Demand Index. Chicago and North Myrtle Beach show the same shape, with yields above 14.5% against demand scores below 20.
|
Market |
Median gross yield |
Demand Index |
|---|---|---|
| Daytona Beach, FL | 15.4% | 15 |
| Chicago, IL | 15.2% | 16 |
| North Myrtle Beach, SC | 14.8% | 16 |
| Honolulu, HI | 14.0% | 19 |
| Gulf Shores, AL | 13.3% | 24 |
Two names carried over from June's underrated list and two did not. Chicago remains on it. Myrtle Beach and Orlando both came off, because investor attention moved toward them while their yields held. That is the specific movement this index exists to capture.
North Myrtle Beach is worth noting separately. It sits directly adjacent to the highest-demand, highest-yield market in the country and delivers 14.8%, yet draws roughly a quarter of the attention its neighbor does.
The markets heating up fastest
Investor interest climbed fastest in Los Angeles in July 2026, where demand rose 211% against June, the sharpest increase of any market we track. Honolulu, Miami Beach, Palm Springs, and Atlanta each posted gains above 80%. Momentum measures the change in search and inquiry activity month over month.
|
Market |
Demand growth (30 days) |
||
|---|---|---|---|
| Los Angeles, CA | +211% | 26 | 8.3% |
| Abilene, TX | +159% | 18 | 13.2% |
| South Bend, IN | +128% | 15 | 14.3% |
| Honolulu, HI | +102% | 19 | 14.0% |
| Miami Beach, FL | +92% | 18 | 11.9% |
| Palm Springs, CA | +84% | 21 | 11.6% |
| Atlanta, GA | +81% | 39 | 11.5% |
Atlanta is the most substantive mover on this list. It is the only market that combined a large percentage gain with a demand score high enough to place it in the overall top fifteen, and it did so at a yield of 11.5%, which is squarely in workable territory. The others are climbing from smaller bases.
The markets that are tougher to pencil
San Diego drew the second-highest investor interest of any U.S. market in July 2026 while posting a median gross yield of 8.0%, the lowest figure in the top fifteen. Nashville, Los Angeles, and Austin share the same profile: heavy buyer attention against returns that are harder to make work.
|
Market |
Demand Index |
Median gross yield |
|---|---|---|
| San Diego, CA | 71 | 8.0% |
| Miami, FL | 45 | 9.6% |
| Nashville, TN | 41 | 8.6% |
| Los Angeles, CA | 26 | 8.3% |
| Austin, TX | 25 | 9.2% |
This is not a list of markets to avoid. It is a list of markets where the purchase price has moved further than the revenue has, so the underwriting has to be tighter and the margin for error is thinner. Investors buying in these markets are often underwriting appreciation, personal use, or a specific property rather than the market median.
Why demand and yield pull apart
Across the markets we track, investor attention and gross yield run in opposite directions. The markets investors search hardest tend to be large, well-known metros where property prices reflect far more than short-term rental revenue potential. Employment, land constraint, and owner-occupier demand all push prices up in San Diego and Nashville in ways that have nothing to do with what a property earns on Airbnb.
The highest-yielding markets tend to be smaller, more seasonal, and more purpose-built for vacation rental. Prices there track rental revenue more closely because rental revenue is a larger share of why anyone buys.
Myrtle Beach is the current exception and worth watching for that reason. It is a purpose-built vacation rental market with yields to match, and investor attention is now catching up to it rather than concentrating in the metros. Whether that persists is exactly the kind of question a monthly index exists to answer, and we will report it either way.
How we measure the STR Investor Demand Index
The STR Investor Demand Index measures investor demand, meaning where people are looking to buy short-term rentals. It does not measure guest booking demand.
The index is built from two signals on Rabbu: market searches by logged-in users, and buyer inquiry submissions, weighted at one and three respectively. Scores are indexed so the highest-demand market equals 100 and every other market scales relative to it. Underlying counts are not published.
Median gross yield is calculated separately and never blended into the index. It is the median of projected annual gross rental revenue divided by asking price across for-sale listings in each market that carry an existing or potential short-term rental signal. These are projections, not verified booking actuals.
Markets qualify for ranking only if they clear a minimum of 25 for-sale listings and 5 interest events in the period. July 2026 figures cover July 1 through July 31, compared against June 1 through June 30.
Full detail, including data sources, exclusions, and known limitations, is on the STR Investor Demand Index methodology page.
Frequently asked questions
What is the STR Investor Demand Index?
The STR Investor Demand Index is a monthly ranking of U.S. short-term rental markets by investor demand, published free by Rabbu. It scores markets from 0 to 100 based on real buyer search and inquiry activity, and publishes each market's median gross yield alongside it.
Which STR market had the highest investor demand in July 2026?
Kissimmee, Florida had the highest investor demand in July 2026, scoring 100 on the STR Investor Demand Index. San Diego ranked second at 71 and Myrtle Beach third at 64.
Which STR market had the highest yield in July 2026?
Myrtle Beach, South Carolina had the highest median gross yield of any major short-term rental market in July 2026 at 16.7%. Daytona Beach followed at 15.4% and Chicago at 15.2%.
Does a high demand score mean a market is a good investment?
No. Demand measures where investors are looking, not where returns are strongest. In July 2026 the second most in-demand market, San Diego, posted the lowest median gross yield in the top fifteen at 8.0%.
How often is the index updated?
Monthly. Each edition reports the prior calendar month and compares it against the month before.
Can I cite this data?
Yes. The STR Investor Demand Index is free to cite and reference with attribution to Rabbu and a link to this page.
Find properties in these markets
Every market in this report has a live inventory page on Rabbu with projected revenue, gross yield, and comparable performance data on each listing. Start with the highest-yielding markets in July: Myrtle Beach, Daytona Beach, Chicago, North Myrtle Beach, and Honolulu.
See where your target market ranks in Rabbu's market data, or browse Airbnbs for sale in the markets showing the strongest returns.