The Rabbu Demand Index is a free, monthly measure of where short-term rental investors are looking to buy, and what those markets are positioned to return. This page explains how it is built, what the numbers mean, and what they do not promise.
Two separate measures
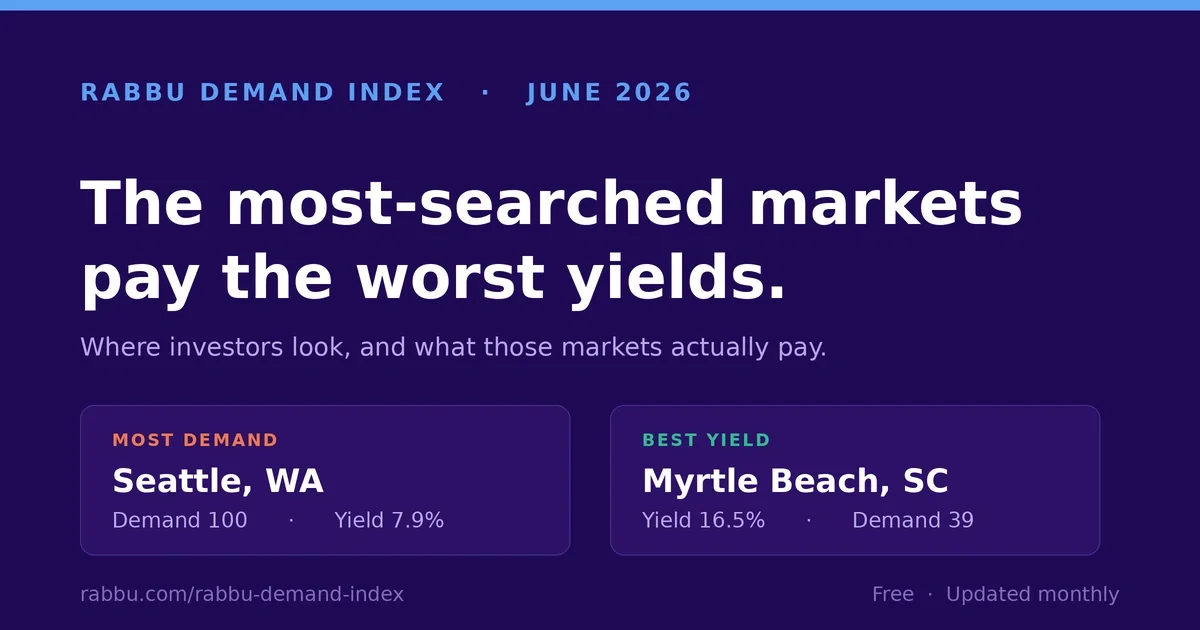
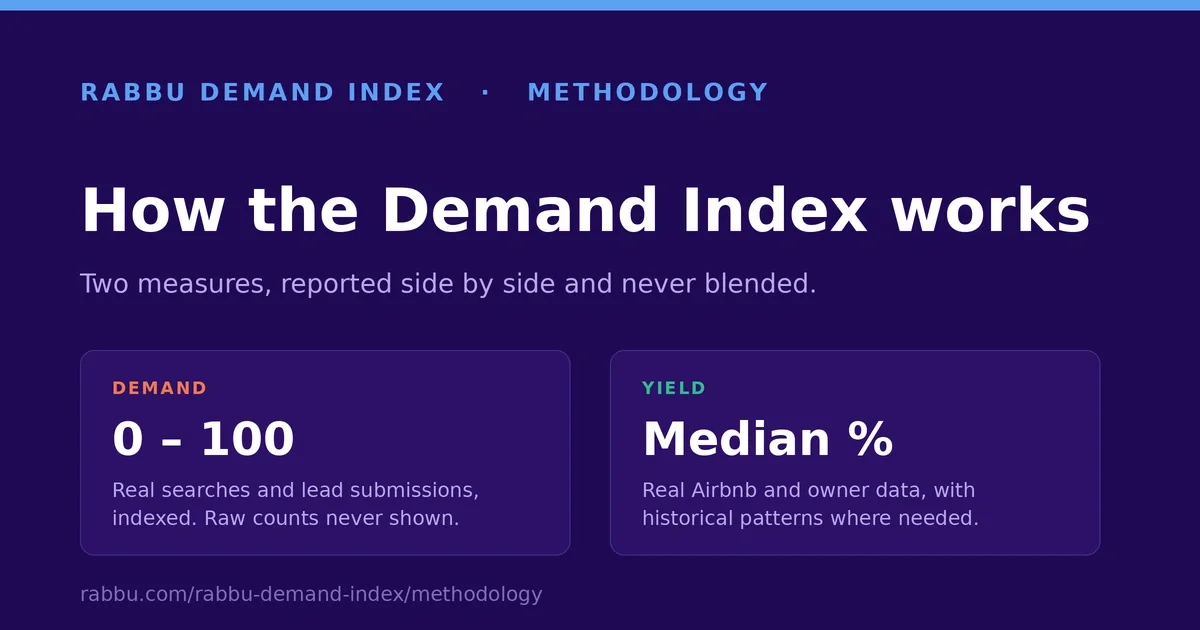
The Index reports two things side by side and never combines them into one score. Demand is how much investor attention a market is getting. Yield is what the market is positioned to return. Keeping them apart is the point, because the most useful signals, an underrated market or an overhyped one, come from the gap between the two.
How we measure demand
Demand is built from real investor behavior on Rabbu: on-site market searches and lead submissions from investors actively looking to buy. A lead submission counts for more than a search, because it is a stronger signal of intent. We combine the two and index every market to a 0 to 100 scale, where the most active market is 100 and every other market scales relative to it. We never publish the underlying counts, so no individual's activity is ever exposed.
Where the yield numbers come from
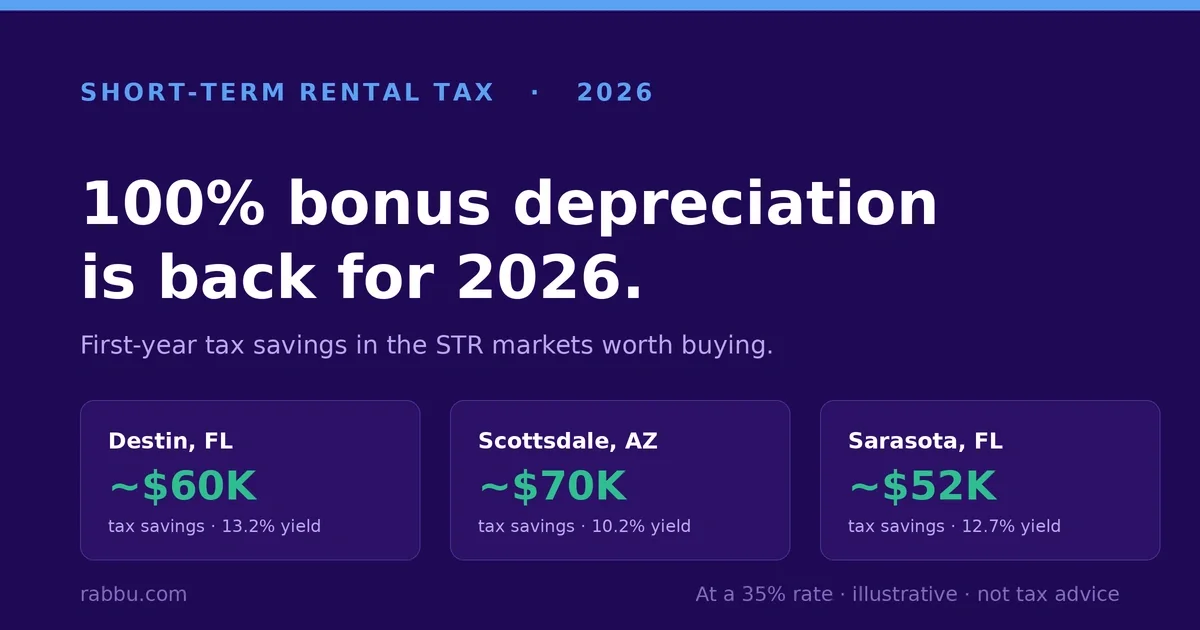
Yield is a market's median annual revenue relative to for-sale property prices, drawn from Rabbu's short-term rental dataset. That data is not a single guess. For many listings, it is real booking performance from platforms like Airbnb, or financials submitted directly by owners and hosts. Where a specific property has no direct data, we estimate from more than five years of historical performance that Rabbu has collected across comparable homes and markets. The figure blends real operating data with historical modeling and leans on real data wherever it exists.
Short-term rentals are operations-driven
A short-term rental's revenue depends heavily on how it is run. A home that earned $100,000 in 2025 is not guaranteed to earn $100,000 in 2026. Depending on pricing, occupancy, guest experience, and the quality of management, that same home could earn far less or considerably more. This is why the Index reports yield at the market level as a directional signal, not a promise for any single property. Use it to compare markets, not to underwrite one address.
How a market qualifies
A market appears only if it clears minimum thresholds for both for-sale listing count and investor interest. This keeps thinly-traded markets, where a few listings could swing the numbers, out of the rankings.
How often it updates
The Index refreshes monthly. Each issue reflects the trailing thirty days of investor behavior against current for-sale inventory, so the picture moves with the market.