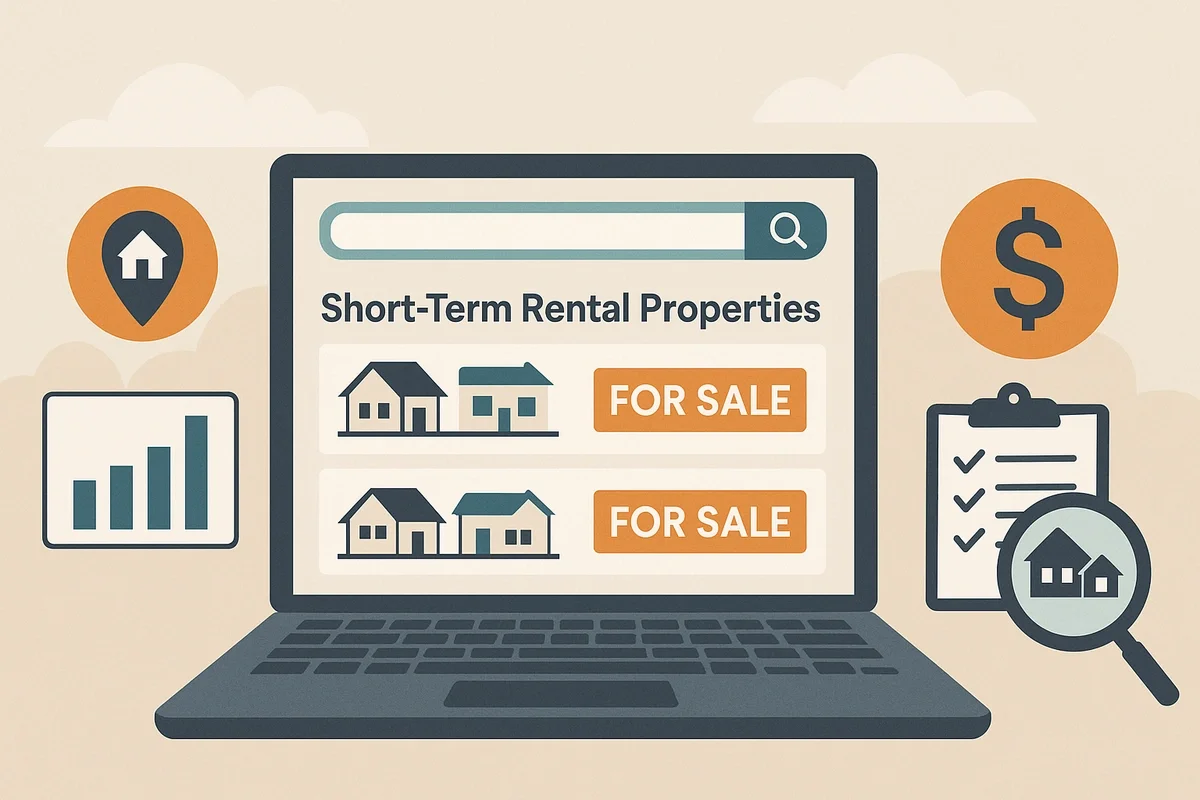
Traditional real estate platforms show you properties for sale but provide zero insight into whether they'll actually generate positive cash flow as Airbnbs. You're left manually researching revenue potential across multiple tools, guessing at occupancy rates, and hoping your agent understands STR regulations—a fragmented process that costs investors thousands in missed opportunities and properties purchased based on optimistic projections rather than verified data.
This guide shows you exactly where to find short-term rental properties with proven income potential, how to analyze deals using data-driven projections, and how to connect with STR-specialized agents and lenders who close deals in weeks instead of months.
The Old Way of Finding Short-Term Rental Properties (And Why It Doesn’t Work)
Short-term rental properties generate 2-3x higher monthly revenue than traditional long-term rentals in top markets, yet most investors waste months searching across platforms that weren't built for vacation rental analysis. Zillow and Realtor.com show you properties for sale but provide zero insight into Airbnb income potential, ROI potential, or whether a property will actually cash flow once you factor in occupancy rates and seasonal demand.
The search process forces you to juggle multiple tools at once. You're browsing MLS listings on one platform, manually researching revenue potential on Airbnb, modeling in spreadsheets, and hoping your real estate agent understands STR markets (most don't). This disconnected approach costs you thousands in missed opportunities and properties purchased based on optimistic guesses rather than verified data.
Why Traditional MLS and Zillow Fall Short for STR Investors
Zillow, Realtor.com, and Redfin optimize their platforms for homebuyers, not income-focused investors. You'll see square footage, bedroom counts, and school ratings—but nothing about average daily rates in the neighborhood, typical occupancy percentages, or whether local regulations even permit short-term rentals at that address.
The platforms also lack STR-specific filters. You can't sort by "properties actively operating as a short-term rental" or "neighborhoods with 75%+ annual occupancy rates." You're left manually clicking through hundreds of irrelevant listings, trying to identify investment opportunities without any data showing which properties actually perform as vacation rentals.
The Hidden Costs of Using Multiple Tools and Guesswork
Cobbling together market research across five different platforms wastes 15-20 hours per property you analyze. You'll spend hours cross-referencing AirDNA's market data with Mashvisor's property-level projections, then manually checking if the numbers align with actual comparable listings on Airbnb—all while hoping your revenue estimates account for cleaning costs, management fees, and seasonal fluctuations you might not fully understand yet.
This fragmented workflow also creates decision paralysis. When you're synthesizing conflicting data from multiple sources, you second-guess every assumption and delay making offers. Meanwhile, investors using integrated platforms with verified performance data close deals in days, not weeks, because they're operating with confidence rather than uncertainty.
The Best STR Deals Never Hit Zillow
Browse exclusive listings for turnkey Airbnbs with actual income data.
Search Exclusive ListingsHow to Find Short Term Rental Properties for Sale the Smart Way
The most effective approach combines data-driven market selection with access to both turnkey Airbnb listings and high-potential conversion properties—all analyzed through a single platform that shows verifiable income history and gross yield potential automatically. Rabbu's marketplace eliminates the guesswork by connecting you with exclusive STR listings you won't find on traditional real estate sites, complete with historical revenue data and profitability projections based on actual market performance.
Step 1: Identify Top Markets with Data-Driven Market Finder
Start by identifying markets where short-term rentals consistently outperform rather than gambling on locations based on personal preferences or vague "hot market" articles. Rabbu's Market Finder lets you compare cities and regions based on average annual ROI, occupancy rates throughout the year, and gross yield percentages—the metrics that actually determine whether your property generates positive cash flow or bleeds money monthly.
Filter for markets with at least 20+ active Airbnb properties to ensure sufficient data reliability, then compare 5-10 potential markets side-by-side before narrowing to your top 2-3 choices. Look for markets showing 65%+ annual occupancy, average daily rates above $150, and regulatory environments that permit short-term rentals without excessive restrictions or permit caps.
Step 2: Choose Your Investment Strategy: Turnkey vs. Conversion
You'll face a fundamental strategic choice: purchase an existing cash-flowing Airbnb with verified performance history, or buy a traditional property and convert it into a short-term rental yourself. Turnkey properties cost 10-25% more than comparable homes but eliminate setup time and provide immediate cash flow from day one. Conversion opportunities offer higher ROI potential if you're willing to invest time furnishing, photographing, and optimizing a listing from scratch.
Turnkey Airbnb benefits:
-
Immediate cash flow: Start earning rental income within weeks instead of months spent on setup and furnishing
-
Verified performance data: Review actual booking history, occupancy rates, and guest reviews rather than relying on projections
-
Easier financing: Lenders approve loans faster when properties show documented income history
-
Proven operations: Inherit established systems for cleaning, guest communication, and pricing that already work
Turnkey Airbnb tradeoffs:
-
Higher purchase price premium: Sellers price in the value of established income streams and operational systems
-
Limited upside potential: Properties already optimized leave less room for value-add improvements that boost returns
-
Performance may not transfer: Previous owner's management style, pricing strategy, or local reputation might not carry over to you
Property conversion benefits:
-
Higher ROI potential: Purchase properties at standard market prices, then force appreciation through strategic improvements
-
Lower entry cost: Avoid the premium turnkey properties command, preserving capital for furnishings and improvements
-
Creative control: Design the property to match your target guest profile rather than inheriting someone else's aesthetic
-
Tax advantages: Deduct furniture, appliances, and improvement costs in the first year rather than depreciating them over decades
Property conversion tradeoffs:
-
Setup time and upfront costs: Budget 2-4 months and $15,000-$40,000 for furnishings, photography, and initial marketing
-
Regulatory uncertainty: Properties without existing STR permits face approval risk if local regulations changed since you researched them
-
Steeper learning curve: You'll make expensive mistakes on pricing, guest screening, and operations without inherited systems
-
Financing complexity: Lenders hesitate to approve loans on properties without income history, requiring larger down payments
Step 3: Navigate Rabbu's Marketplace for Exclusive Listings
Once you've identified your target markets and chosen your strategy, browse properties on Rabbu's marketplace where you'll find two distinct inventory types. Active Airbnb listings are already operating as Airbnbs and the ones tagged with Actual Financials have verified income. The Airbnb Potential properties are homes that would perform well as short-term rentals based on zoning, location and amenities.
Filter for properties tagged "Active Airbnb" if you want turnkey investments, or search "Airbnb Potential" if you're pursuing conversion opportunities with higher ROI upside. Set your price filter above $300,000 to focus on properties in markets where vacation rentals generate meaningful income—ultra-cheap properties rarely exist in desirable STR locations.
Sort results by Gross Yield to identify properties generating the highest returns relative to purchase price, typically looking for yields in the 5-30% range depending on your market and risk tolerance. If you’re not seeing enough results, add properties tagged with Former Airbnb, Agent Pick, or Public Listings.
Set up saved search alerts for your target markets so you receive notifications within hours when new listings match your criteria, giving you competitive advantage over investors manually checking platforms daily.
Find the Right Airbnb Investment Property
Search exclusive listings for both turnkey and potential Airbnb properties in one place.
Explore Airbnbs for SaleStep 4: Analyze Properties Using Rabbu's Integrated Calculator
Click into any listing to access Rabbu's Investor Return Calculator, which automatically pulls comparable property data to project monthly revenue, occupancy rates, and operating expenses specific to that address. The calculator analyzes similar properties within a 2-mile radius that match your target property's bedroom count, amenities, and guest capacity—giving you projections based on actual market performance rather than optimistic guesses. You can also manually adjust all inputs to reflect your underwriting assumptions:
-
Revenue: Accounts for RevPAN, and other income
-
Total investment: Totals the purchase price, closing costs, immediate repairs, furnishing costs, and initial expenses.
-
Expenses: Totals the channel fee, property management fee, supply fees, property taxes, insurance, HOA fees, utilities, maintenance, and other expenses.
-
Financing: Takes into account down payment, loan closing costs, interest rate, interest type, and amortization term.
Review the projected cash-on-cash return (annual cash profit divided by your total cash investment) to determine if the property meets your return thresholds, typically targeting 8-12% for turnkey properties or 15-20%+ for conversion opportunities. All of this information will help you determine if your Airbnb will be profitable before even making an offer.
Step 5: Connect with STR-Specialized Agents
Once you've identified 3-5 properties worth pursuing, connect with STR-specialized agents through Rabbu's network who understand vacation rental markets and can help you negotiate based on cash flow potential rather than just comparable sales.
STR-specialized agents also understand how to structure offers that appeal to sellers—for example, emphasizing quick closes with DSCR financing rather than conventional mortgages that take 45-60 days and often fall through due to appraisal issues.
Best U.S. Markets for High-Return STR Investments
Top-performing STR markets combine strong tourism demand, favorable regulations, and limited hotel supply—creating conditions where vacation rentals consistently achieve 70%+ occupancy at premium nightly rates. Markets near national parks, beach destinations, ski resorts, and major event venues (theme parks, music festivals, sports complexes) generate the most reliable year-round or seasonal demand that translates into predictable cash flow.
Top Five States by Average Annual Airbnb Revenue
Florida dominates STR performance due to year-round tourism, proximity to Disney and Universal Studios, and beach destinations that attract both domestic and international travelers. Properties near Orlando theme parks and Gulf Coast beaches consistently generate $45,000-$75,000+ annually, while Miami and Fort Lauderdale properties serving business travelers and cruise passengers command premium rates.
Tennessee's Smoky Mountains region and Nashville's music tourism create two distinct high-performing markets—Gatlinburg and Pigeon Forge cabins near national parks achieve 75-85% annual occupancy, while Nashville's urban STRs benefit from bachelorette parties, music festivals, and convention traffic. Texas markets like Austin, San Antonio, and Hill Country wine regions attract both leisure and business travelers, with properties near downtown entertainment districts and Lake Travis generating strong returns.
Colorado's ski resort towns (Breckenridge, Vail, Aspen) and mountain destinations command the highest average daily rates in the country during winter season, though you'll need to account for significant seasonal fluctuations. California's diverse tourism—from Napa Valley wine country to San Diego beaches to Joshua Tree desert retreats—supports premium pricing, though regulatory restrictions in cities like San Francisco and Los Angeles limit where you can legally operate.
Emerging Secondary Markets Worth Watching
Smaller cities gaining traction for STR investments share common characteristics: proximity to outdoor recreation, growing remote work populations seeking "workcation" destinations, and local governments that haven't imposed restrictive regulations yet. Markets like Asheville NC, Bend OR, and Traverse City MI attract investors before competition drives up property prices and occupancy rates plateau.
Look for markets where new direct flights recently launched (indicating growing tourism interest), where hotel supply hasn't kept pace with visitor growth, and where average daily rates increased 15%+ year-over-year. The signals suggest demand outpacing supply—the ideal condition for new STR investments to capture underserved market share.
Market Factors That Drive Nightly Rates
Tourism seasonality determines whether your property generates consistent income year-round or concentrates revenue into 3-4 peak months. Beach destinations peak in summer, ski towns in winter, and business-travel markets maintain steadier occupancy throughout the year. Understanding your market's shoulder season (the periods between peak and off-peak) helps you set realistic revenue expectations and budget for months when occupancy drops to 40-50%.
Average Daily Rate (ADR)—the average price guests pay per night—varies dramatically based on property amenities, proximity to attractions, and local event calendars. Properties within walking distance of beaches, ski lifts, or downtown entertainment districts command 30-50% premiums over comparable homes requiring 15-minute drives. Unique amenities like hot tubs, game rooms, or waterfront access justify nightly rates $50-$150 above basic properties.
Supply constraints in markets with limited new construction or restrictive zoning protect existing STR operators from competition that would erode occupancy rates. Markets that cap STR permits or restrict short-term rentals to specific zones create artificial scarcity that benefits investors who secure properties before permit allocations fill.
Use Rabbu’s market finder tool to easily rank markets based on the tangible performance metrics discussed above. The best STR markets combine high occupancy, strong ROI, and healthy gross yield relative to home prices.
Airbnb Properties for Sale in Orlando, Florida Snapshot
Orlando represents the gold standard for STR investing due to proximity to Disney World, Universal Studios, and SeaWorld—attractions that drive 75+ million annual visitors creating consistent year-round demand. Properties within 15 minutes of theme park entrances achieve 80-90% annual occupancy, with families booking 6-12 months in advance for peak seasons (summer, spring break, major holidays).
Median Purchase Price and Typical Revenue
Single-family vacation homes in Orlando's primary STR corridors (Kissimmee, Davenport, Champions Gate) typically cost $350,000-$650,000 for 4-6 bedroom properties designed to accommodate large families or multi-family groups. Properties generate $50,000-$85,000 in annual gross revenue when professionally managed and marketed, translating to $25,000-$45,000 in net operating income after expenses.
Townhomes and condos closer to attractions offer lower entry points ($200,000-$350,000) but generate proportionally less revenue ($30,000-$50,000 annually) due to smaller guest capacity. The key metric—gross yield (annual revenue divided by purchase price)—typically ranges from 12-18% in Orlando, significantly outperforming most other U.S. markets where 8-12% yields are more common.
Neighborhoods With High Occupancy Rates
Kissimmee properties south of Disney achieve the highest occupancy due to proximity and lower nightly rates that appeal to budget-conscious families. Davenport and Clermont communities west of Disney offer newer construction with resort-style amenities (lazy rivers, water slides, clubhouses) that justify premium pricing while maintaining 75-85% occupancy.
Champions Gate properties appeal to golfers and families seeking upscale accommodations—homes command higher nightly rates ($250-$450) but still achieve strong occupancy due to the neighborhood's reputation and amenities. Avoid properties north of Orlando or more than 30 minutes from attractions, as locations struggle to maintain 60%+ occupancy despite lower purchase prices.
Typical Regulation Hurdles Around Disney
Orange County permits short-term rentals but requires a resort dwelling license costing approximately $185 annually, plus transient occupancy tax collection (6% county tax plus any applicable municipal taxes). Most properties in vacation home communities operate legally under existing permits, though you'll want to verify the specific property's compliance status before closing—some neighborhoods require minimum 7-day stays or prohibit rentals under 30 days entirely.
HOA restrictions pose the biggest regulatory risk in Orlando—many newer communities ban short-term rentals or require minimum 6-month leases to maintain "residential character." Always review HOA covenants and restrictions before making offers, as private rules override county regulations and can instantly kill your STR investment plans.
The Best STR Deals Never Hit Zillow
Browse exclusive listings for turnkey Airbnbs with actual income data.
Search Exclusive ListingsProjecting Revenue and Cash-on-Cash Return Using Rabbu's Free Calculator
Accurate revenue projections separate successful STR investors from folks who overpay for underperforming properties based on seller claims or optimistic guesses. Cash-on-cash return—your annual cash profit divided by total cash invested (down payment plus closing costs plus furnishings)—tells you whether a property generates acceptable returns relative to the capital you're tying up, typically targeting 10-15% minimum for STR investments to justify the effort versus passive stock market returns.
Step-by-Step Revenue Analysis with Rabbu's Tools
Enter your target property's address into Rabbu's free revenue Calculator, which automatically identifies comparable Airbnb listings within a 2-mile radius that match your property's characteristics. Filter comparables to include only properties with 5+ guest reviews and ratings of 4.9+ stars, ensuring you're modeling performance based on well-managed properties rather than underperforming listings that skew projections downward.
Match amenities carefully—don't compare your 4-bedroom house with a pool to 4-bedroom properties without pools, as pools typically increase nightly rates by $30-$60 and boost occupancy by 10-15 percentage points. Aim for 5-10 comparable listings to ensure statistical reliability while avoiding outliers that distort projections (exclude the single property charging $800/night when most comparables rent for $200-$300).
Toggle between 75th percentile (top-quartile performance if you manage well) and 90th percentile (exceptional performance requiring professional management and optimization) scenarios to understand your realistic upside. Conservative investors use 50th percentile projections to ensure properties still cash flow even if they perform merely average, while experienced operators comfortable with active management can underwrite to 75th percentile expectations.
Core Expenses Many Investors Undercalculate
First-time STR investors consistently underestimate operating expenses, projecting 25-30% expense ratios when reality runs 40-50% of gross revenue for professionally managed properties. Rabbu's expense calculator incorporates market-specific costs rather than generic percentages, showing you actual cleaning fees, management rates, and utility costs in your target neighborhood.
Common expense categories investors underestimate:
-
Cleaning costs: Per-turnover fees of $100-$250 per booking add up quickly—a property with 100 annual bookings spends $10,000-$25,000 on cleaning alone, or 15-25% of gross revenue
-
Maintenance reserves: Budget 10-15% of revenue for repairs, replacements, and emergency fixes—HVAC failures, plumbing issues, and appliance replacements occur more frequently in vacation rentals than owner-occupied homes
-
Property management: Professional managers charge 20-30% of gross revenue but handle guest communication, cleaning coordination, pricing optimization, and maintenance—often increasing revenue enough to offset their fees
-
Marketing expenses: Professional photography ($300-$800), listing optimization, and paid advertising to boost visibility in saturated markets
Understanding Cap Rate, ROI, and Cash-on-Cash Returns
Cap rate (net operating income divided by purchase price) measures property performance independent of financing, helping you compare properties objectively. A 7% cap rate means the property generates $35,000 in NOI annually on a $500,000 purchase price—useful for comparing markets but less relevant than cash-on-cash return for leveraged investors.
Return on Investment (ROI) measures your total return including appreciation, equity paydown, and cash flow, but requires assumptions about future property value increases. Cash-on-cash return focuses solely on the cash profit you receive relative to cash invested, making it the most reliable metric for evaluating whether a property meets your income goals.
All of these metrics are automatically calculated in our Investor Return Calculator, which can be found on the property detail page for every active listing in Rabbu’s marketplace as well as on the Airbnb Calculator (which works for any address in the US whether actively listed or not). You can fine tune any of the expense inputs that factor into these calculations. The calculator takes into account all the following expenses:
-
Total investment: Totals the purchase price, closing costs, immediate repairs, furnishing costs, and initial expenses.
-
Expenses: Totals the channel fee, property management fee, supply fees, property taxes, insurance, HOA fees, utilities, maintenance, and other expenses.
-
Financing: Takes into account down payment, loan closing costs, interest rate, interest type, and amortization term.
All of this information will help you determine if your Airbnb will be profitable before even making an offer.
DSCR (Debt Service Coverage Ratio) matters primarily for financing—lenders want to see property income exceeding mortgage payments by 20-25% (DSCR of 1.20-1.25) to approve loans. A property generating $4,800 monthly with $3,600 in debt service shows a 1.33 DSCR, comfortably qualifying for most DSCR loan programs while providing a $1,200 monthly cushion for vacancies and unexpected expenses.
Financing Options Designed for Short-Term Rentals
Traditional mortgages fail STR investors because underwriters either ignore vacation rental income entirely or discount it by 25-50%, forcing you to qualify based on W-2 earnings that don't reflect the property's actual cash flow potential. DSCR loans flip the model—lenders qualify you based solely on whether the property's projected income covers its mortgage payment, completely ignoring your personal income, tax returns, and employment status.
DSCR Loans and Asset-Based Mortgages
DSCR loans evaluate one simple question: does the property generate enough income to cover its debt obligations? If your property projects $4,800 monthly revenue with $3,600 in total housing costs (principal, interest, taxes, insurance, HOA), your 1.33 DSCR qualifies you for financing—regardless of whether you're W-2 employed, self-employed, or retired.
Rabbu's lender network specializes in DSCR products with 15-25% down payments (versus 20-30% for conventional investment loans), interest rates typically 0.5-1.5% higher than owner-occupied mortgages, and closing timelines of 21-30 days instead of 45-60. The loans also eliminate the 10-property limit that caps conventional financing, allowing unlimited portfolio scaling as long as each property individually cash flows.
Vacation-Home Loans With Second-Home Rates
Conventional "second home" financing offers lower rates than investment property loans if you're willing to certify you'll personally use the property occasionally—typically requiring 50+ miles from your primary residence and limiting rental activity. The loans work best for investors who genuinely plan to use the property for personal vacations while renting it out the remaining weeks, though you'll face restrictions on how frequently you can rent and may need to block your own calendar during peak seasons.
Lenders offering vacation home loans require strong personal income documentation, credit scores of 680+, and down payments of 10-20% depending on the property type and location. You'll pay interest rates close to primary residence rates (often 0.25-0.75% higher), making this the cheapest financing option for investors who qualify and can legitimately use the property personally.
When to Use Partners or Syndications
Joint ventures and real estate syndications allow you to invest in properties you couldn't afford individually, splitting ownership with partners who contribute capital, expertise, or management capabilities. Typical partnership structures include 50/50 equity splits where one partner provides capital and another handles operations, or syndications where a sponsor manages the property while passive investors contribute funds for equity shares.
Partnerships work best when you've identified a high-performing property but lack sufficient capital for the down payment, or when you want to invest in multiple markets simultaneously without managing properties yourself. Define roles, responsibilities, profit splits, and exit strategies in written operating agreements before purchasing—partnership disputes destroy more STR investments than market downturns or regulatory changes.
Find a Lender that Specializes in Short-Term Rentals
Connect with lenders who actually understand short-term rental cash flow and offer DSCR loans, portfolio financing, and investor-friendly terms.
Get Matched with STR LendersRegulation and Zoning Checks Before You Submit an Offer
Buying a property that can't legally operate as a short-term rental ranks among the costliest mistakes investors make—you're stuck with a property that only generates long-term rental income (60-70% less than STR projections) or forced to sell at a loss. Rabbu's STR-specialized agent network understands local regulations and can help you verify compliance before you waste time and money pursuing properties in restricted areas.
City and County STR Ordinance Checklist
Research local regulations before making offers by checking permit requirements (does the city require STR licenses, and are permits currently available or capped?), zoning restrictions (are short-term rentals permitted in all zones or limited to specific districts?), occupancy limits (do regulations cap guest counts below the property's sleeping capacity?), minimum stay requirements (do local rules mandate 3-day, 7-day, or 30-day minimum stays?), and registration processes (how long does permit approval take, and what documentation is required?).
Many cities maintain online STR registries showing which properties hold active permits—search databases to verify the property you're considering either has an existing permit or is located in an area where permits are available. If permit allocations are capped and none are currently available, walk away unless you're comfortable operating as a long-term rental.
HOA, Condo, and Co-Op Rule Pitfalls
Private community restrictions override city regulations, meaning a property can be zoned for STR use but still be prohibited by HOA covenants. Request HOA documents during your inspection period and specifically review sections addressing rentals, leasing, and transient occupancy.
Common HOA restrictions that kill STR plans:
-
Outright bans on rentals shorter than 6-12 months
-
Minimum stay requirements (7 days, 30 days) that eliminate most vacation rental bookings
-
Guest registration requirements and parking restrictions that create operational friction
-
Rental caps limiting the percentage of units that can be rented at any time
Condo and co-op buildings frequently impose stricter rules than single-family HOAs due to shared amenities and closer proximity between units. Even if current rules permit short-term rentals, review HOA meeting minutes to check whether restriction proposals are under discussion—boards can change rules with simple majority votes, potentially banning your rental activity after you've closed.
Backup Exit Strategies if Laws Tighten
Medium-term rentals targeting traveling professionals, relocating families, and contract workers provide fallback options if short-term rental regulations become restrictive. The 30-90 day bookings often fall outside STR regulations while generating 150-200% of long-term rental rates, though you'll sacrifice the premium nightly rates and flexibility that make short-term rentals attractive.
Traditional long-term rentals represent your worst-case scenario—properties that can't operate as STRs still generate rental income, just 60-70% less than vacation rental projections. Before purchasing, calculate whether the property cash flows as a long-term rental to ensure you're not upside-down if regulations change.
Resale provides an exit if you can't operate the property as planned, though you'll face transaction costs of 6-8% plus any market depreciation. Properties in desirable locations near attractions, beaches, or mountains maintain strong owner-occupant demand even if STR regulations tighten, protecting your ability to sell without significant losses.
Build Your STR Portfolio Faster With Rabbu's Free Airbnb Marketplace
Rabbu's platform eliminates the fragmented, time-consuming process of finding and analyzing STR properties by integrating market research, property listings, revenue projections, and lender connections into a single workflow. Instead of spending weeks juggling multiple tools and hoping your analysis is accurate, you access verified performance data and exclusive listings that aren't available on traditional real estate sites.
Browse our marketplace and find profitable Airbnb investments that cashflow with confidence, knowing every property displays data-backed revenue projections, regulatory compliance status, and ROI calculations that help you make offers within days instead of weeks. Rabbu's STR-specialized agent network provides local market expertise and access to off-market deals, while integrated lender matching connects you with DSCR financing that qualifies you based on property income rather than personal tax returns.
The difference between investors who build portfolios of 5-10+ properties and folks who struggle to acquire their second property often comes down to tools and data access. Rabbu's platform gives you the competitive advantages that separate successful STR investors from those who never move past analysis paralysis.
Find the Right Airbnb Investment Property
Search exclusive listings for both turnkey and potential Airbnb properties in one place.
Explore Airbnbs for SaleFrequently Asked Questions About Buying Short Term Rental Properties
What is the 80/20 rule for Airbnb?
The 80/20 rule suggests that approximately 80% of your annual Airbnb revenue will come from roughly 20% of the calendar year—typically your market's peak season. Beach destinations earn most of their income during summer months, ski towns during winter, and theme park markets during school breaks and holidays. Use Rabbu's seasonality data to identify peak periods and ensure your cash flow projections account for significant monthly fluctuations rather than assuming consistent year-round income.
How does the 2% rule apply to short term rentals?
The 2% rule states that monthly rental income equals at least 2% of the property's purchase price—a $300,000 property generates $6,000+ monthly to meet the threshold. Short-term rentals frequently exceed the benchmark due to higher nightly rates, with many properties achieving 3-4% monthly returns during peak seasons. However, you'll want to evaluate annual revenue rather than peak month performance, as most STR properties show significant seasonal variation that makes monthly analysis misleading.
Where do short term rentals make the most money?
STR properties typically perform best in tourist destinations with limited hotel inventory, areas near major attractions or natural features, and markets with favorable regulatory environments. Florida's theme park corridors, Tennessee's Smoky Mountains, Colorado ski towns, and California wine country consistently rank among top-performing markets. Use Rabbu's Market Finder to identify high-performing markets based on ROI, occupancy rates, and gross yield rather than relying on generic "hot market" lists that don't account for your specific investment criteria.
Should I buy a turnkey Airbnb or convert a regular home?
Turnkey properties offer immediate cash flow and verified performance but cost 10-25% more than comparable homes, while conversions provide higher ROI potential if you're willing to invest 2-4 months and $15,000-$40,000 in furnishings and setup. First-time investors often benefit from turnkey properties that provide established systems and eliminate the learning curve, while experienced operators pursue conversions to maximize returns through strategic improvements and optimization. Make sure you search on a platform like Rabbu that clearly differentiates between turnkey Airbnbs and listings with airbnb conversion potential.
Can I switch to medium-term rentals if STR laws change?
Medium-term rentals targeting traveling professionals, relocating families, and contract workers offer flexible backup strategies if short-term rental regulations become restrictive. The 30-90 day bookings typically fall outside STR regulations while generating 150-200% of traditional long-term rental rates, though you'll sacrifice the premium nightly rates and booking flexibility that make short-term rentals attractive.
How much time does self-managing a short-term rental really take?
Self-managing typically requires 5-10 hours weekly for guest communication, coordinating cleanings, handling maintenance requests, and optimizing pricing—though workload varies significantly based on occupancy rates and property condition. Many investors underestimate the time commitment and switch to professional management after their first few months, paying 20-30% of revenue to reclaim their time while often increasing overall revenue through better optimization and guest experience.
Don't Let Financing Kill Your Deal
Most banks don't understand short-term rentals. These lenders do.
Find a Lender