You’ve probably seen the success stories of investors turning ordinary homes into high-performing Airbnbs generating thousands in monthly cash flow. But behind every profitable short-term rental (STR) is careful analysis and data-driven planning. The reality? Most investors don’t fail because they bought the wrong property, they fail because they guessed instead of calculated.
If you’ve ever wondered, “How do I know if my Airbnb property will be profitable?” This guide will show you exactly how to find out. You’ll learn how to analyze STR performance, calculate true returns, and avoid the hidden pitfalls that trap first-time investors.
This guide walks you through revenue estimation using market data, comprehensive expense tracking, cash-on-cash return calculations, stress-testing for worst-case scenarios, and connecting with STR-specialized agents and lenders who understand short-term rental investments. You'll learn how to validate profitability before making an offer using the same data-driven approach that successful STR investors rely on.
The Old Way of Analyzing STR Profitability (And Why It Fails)
To determine if an Airbnb property will be profitable, you need to estimate potential rental income by analyzing local occupancy rates and average daily rates, then subtract all expenses including mortgage, utilities, taxes, cleaning, and management fees to calculate cash flow and return on investment. Strong profitability indicators include occupancy rates between 60-80%, positive monthly cash flow after all expenses, and a capitalization rate of 8-12% or higher.
Before platforms like Rabbu existed, analyzing STR profitability meant juggling multiple disconnected tools and spending weeks on manual research. You'd browse Zillow or Realtor.com—sites built for people buying homes to live in, not investment properties—and try to guess which listings might work as short-term rentals based on location alone.
The data you needed was scattered everywhere. Market performance metrics lived on one platform, zoning regulations on municipal websites, comparable property analysis required scrolling through dozens of Airbnb listings, and financial projections meant building complex spreadsheets from scratch. Even after weeks of work, your projections were still educated guesses at best.
The Traditional (Broken) Process
Here's what the old approach looked like:
-
Browse residential real estate sites designed for owner-occupied housing
-
Manually research local STR regulations, permit caps, and zoning restrictions
-
Hunt through active Airbnb listings to estimate occupancy and nightly rates
-
Build spreadsheets to calculate returns based on incomplete information
-
Hope your assumptions about seasonal demand and operating costs were accurate
This fragmented process took weeks per property and still left you guessing about critical factors like actual revenue potential and regulatory compliance.
Why Traditional Agents Fall Short
Most real estate agents understand residential transactions but can't advise on STR-specific considerations. They don't know which neighborhoods have permit availability, what amenity packages drive the highest returns, or how to price properties based on cash flow potential instead of comparable sales.
Traditional agents work from the MLS, which doesn't include active Airbnb properties for sale or show income history for turnkey STR investments. They negotiate based on what similar houses sold for, not how much money the property will actually generate. Even well-intentioned agents often provide overly optimistic income projections without understanding seasonal demand patterns or the true cost of STR operations.
Why Traditional Lenders Don't Work
Conventional mortgage lenders create additional barriers by failing to recognize STR income potential. They'll discount your projected $4,500 monthly Airbnb revenue to $1,800 based on long-term rental comparables—or ignore the income entirely. This means you qualify based solely on W-2 earnings, face larger down payment requirements, and endure 45-60 day closing timelines that cause you to lose deals to faster buyers.
For self-employed investors who've optimized their tax strategy, conventional lenders often reject applications outright despite strong actual cash flow. The 10-property financing ceiling imposed by Fannie Mae and Freddie Mac guidelines stops portfolio growth at exactly the moment your expertise peaks.
The New Way: Rabbu's Integrated Short-Term Rental Investment Platform
The fastest way to analyze STR profitability is through Rabbu's platform that consolidates market research, property discovery, income analysis, and acquisition support. Instead of spending weeks juggling multiple tools, you access verified data and specialized expertise in one place.
Rabbu addresses every fragmented piece of the traditional process. You can identify top-performing markets using real occupancy and revenue data, browse curated listings with built-in profitability projections, and connect with STR-specialized agents and lenders who understand cash flow-based investing.
Streamlined Three-Step Process
First, use Market Finder to discover high-ROI STR markets with verified performance data and favorable investment conditions. Second, browse the Rabbu Airbnb marketplace for exclusive STR properties and conversion opportunities with historical income data or data-backed projections already calculated. Third, work with STR-focused agents who understand local regulations and DSCR lenders who qualify you based on property cash flow rather than personal income.
This integrated approach eliminates the weeks of research and uncertainty that come with traditional STR analysis.
Find the Right Airbnb Investment Property
Search exclusive listings for both turnkey and potential Airbnb properties in one place.
Explore Airbnbs for SaleDetermine Your Revenue Potential With an Airbnb Income Calculator
If you already have a property that you’re considering turning into an Airbnb, start with Rabbu's calculator to establish baseline revenue estimates backed by actual market data. An Airbnb income calculator estimates average daily rate, occupancy, and seasonal patterns using verified listing data to project revenue.
Unlike generic calculators that rely on outdated or incomplete data, Rabbu's calculator analyzes active listings to provide market-specific projections. You'll see how similar properties in your target neighborhood actually perform rather than relying on national averages that don't reflect local dynamics.
Use Rabbu's Airbnb Calculator for Accurate Projections
Navigate to Rabbu's Airbnb Calculator and enter your target property address. The platform automatically identifies comparable listings within 2-3 miles that match your property's bedroom count and key features.
Set filters for high-quality comparables by selecting properties with Guest Reviews >5 and Average Rating ≥4.9. Adjust amenities to match your target property's features—pools, hot tubs, waterfront access, and unique amenities command premium rates. The calculator recalculates projections based on these differentiators.
Top hosts consistently earn 20-40% above market medians through superior hospitality, professional photography, and dynamic pricing strategies. Model your projections based on 75th-90th percentile performance rather than market medians to see what's possible with excellent execution.
Validate Nightly Rate and Occupancy Assumptions
Review the Revenue Projection displayed at the top of the screen, which shows estimated annual income based on comparable property performance. Toggle between 75th and 90th percentile views to understand the range between good and exceptional performance in your target market.
Check seasonal variations by scrolling to the monthly breakdown section. Tourism markets like ski towns or beach destinations show dramatic swings between high and low seasons, while business travel markets maintain steadier year-round occupancy. Verify comparable quality by clicking through to review property photos and guest ratings.
Enhance Results with Rabbu's Market Data
Rabbu's Market Data tool provides deeper insights into local STR dynamics beyond individual property projections. You'll see market-wide trends that inform your investment strategy and capital improvement decisions.
Analyze seasonality patterns to understand when demand peaks and valleys occur, allowing you to model cash flow timing accurately. Bedroom mix data reveals which unit sizes dominate revenue in your target market. Amenity impact analysis shows which upgrades deliver the highest ROI—if properties with pools command 25% rate premiums but hot tubs only add 8%, you know where to allocate renovation budgets.
Choose Between Turnkey Airbnbs vs. Conversion Opportunities
If you don’t yet have a property that you’re considering turning into an Airbnb, you’ll need to find one to buy. There are two main types of short-term rental properties to choose from, which we’ll break down in this section. Rabbu's marketplace offers both active STR properties and conversion opportunities, each with distinct advantages for different investor profiles. Your choice depends on your timeline, capital availability, risk tolerance, and operational preferences.
Active STR Properties: Immediate Cash Flow
Turnkey Airbnb properties are already operating as short-term rentals with established booking history, verified income, and proven market validation. You're buying a functioning business rather than just real estate.
Benefits:
-
Immediate Cash Flow: Start earning income within days of ownership transfer rather than waiting months through setup and launch phases
-
Verified Performance Data: Analyze actual historical revenue instead of projections, eliminating the largest source of investment risk
-
Proven Market Validation: Properties already approved for STR use with established guest bases and operational systems in place
-
Easier Financing: Income history strengthens DSCR loan applications since lenders can verify actual performance
-
Passive Ownership Potential: Often includes existing management relationships and operational procedures you can maintain or modify
Tradeoffs:
Premium pricing reflects the convenience and established cash flow, typically 10-25% above comparable non-STR properties. Design decisions and guest experience elements are already established, limiting your ability to differentiate. Value-add opportunities may be limited since previous owners have already optimized major revenue drivers.
Turnkey properties work best for investors who prioritize immediate returns over maximum ROI, prefer passive ownership, or lack time to manage renovation and launch phases.
Conversion Properties: Higher ROI Potential
Conversion opportunities are traditional residential properties that aren't currently operating as STRs but show strong potential based on location, amenities, and comparable property performance. You're creating an STR business from scratch.
Benefits:
-
Higher ROI Potential: Control costs and create equity through strategic renovations and furnishing choices
-
Lower Entry Cost: Avoid paying premiums for established STR operations, often acquiring properties 15-30% below comparable turnkey listings
-
Creative Control: Design unique guest experiences and implement your operational vision from day one
-
Tax Advantages: Depreciate furnishings, renovations, and setup expenses in year one
-
Learning Opportunity: Hands-on experience with every aspect of STR operations builds expertise that compounds as you scale
Tradeoffs:
Expect 2-4 months of preparation before your first booking, including renovations, furnishing, permitting, and listing optimization. You face regulatory risk since you independently verify STR compliance and navigate local approval processes. Trial-and-error phases with pricing and operations can impact early performance. Financing is more complex since you qualify based on personal finances rather than property income.
Conversion properties suit investors who enjoy active involvement, have renovation experience or trusted contractors, and can afford 3-6 months without rental income during setup phases. Browse Rabbu's marketplace to compare both options.
Here’s some helpful tips to navigate the marketplace:
-
Navigate to the Rabbu Marketplace
-
Select your chosen markets,
-
If you’re looking for a turnkey Airbnb, then click All Filters → Tags → Active Airbnb.
-
Active Airbnb = verified Airbnb listings with actual performance history.
-
Actual Financials = actual historical financials inputted by the seller or listing agent
-
-
Set price filters (typically >$300K) based on market norms.
-
Sort by Gross Yield, and filter results to 5–30% yield range.
-
If you’re looking for a property with STR potential, add tags for Airbnb Potential, Former Airbnb and Agent Pick.
-
If too few results:
-
Still low? Include Public Listings (less vetted, but higher volume).
-
-
To stay updated, click Save Search → set up email alerts for new matching properties.
-
Note that you must have a Rabbu account to save a search (it’s free)
-
-
When you find a property you like, click Contact Agent to inquire
The Best STR Deals Never Hit Zillow
Browse exclusive listings for turnkey Airbnbs with actual income data.
Search Exclusive ListingsRefine Projections Using Local Airbnb Comps
Rabbu's calculator automatically identifies comparable properties, but understanding the methodology helps you validate projections and adjust for property-specific factors. Comps are similar active listings whose pricing and occupancy patterns inform realistic revenue assumptions for your target property.
The quality of your comparable analysis directly impacts projection accuracy. Poor comp selection—using properties in different neighborhoods, with significantly different amenities, or with low guest ratings—produces unreliable projections.
Identify Quality Comparables Through Rabbu
Use Rabbu's filtered comp set with verified high-performing properties as your starting point. The platform prioritizes listings with consistent booking history, strong guest ratings, and similar property characteristics to your target.
Focus on properties with the same bedroom count, location proximity within 1-3 miles, and comparable amenity mix. A 3-bedroom lakefront cabin with a hot tub has different revenue potential than a 3-bedroom suburban house without water access. Prioritize listings with 4.9+ ratings and substantial review counts—properties with fewer than 10 reviews may not have established stable booking patterns.
Adjust for Property Differentiators
Properties with pools, hot tubs, or unique features command 15-30% premium rates in most markets. If your target property includes amenities not present in your comp set, adjust projected rates upward proportionally based on amenity impact data from Rabbu's Market Data tool.
Normalize rates by adding or subtracting for extra bedrooms, standout views, or proximity advantages. A property 200 yards from beach access versus 2 miles away might justify 20% higher rates even with identical interior features. Consider property condition and furnishing quality—if your target property needs updates while comps show recently renovated interiors, conservative projections discount rates by 10-15% until you complete improvements.
Account for Seasonality and Local Events
Tourism patterns and local events significantly impact occupancy and pricing, creating revenue variations of 200-300% between peak and off-seasons in some markets. Separating high season ADRs from low season rates prevents inflated annual projections based on peak performance.
Factor in major local events, conferences, and holiday demand spikes that create temporary rate premiums. A property near a major festival venue might earn $500/night during event weekends but only $150/night during normal periods. Use Rabbu's seasonal breakdown feature to see month-by-month performance patterns rather than relying on annual averages.
The table below shows a sample comparable property analysis:
|
Bedrooms |
Amenities |
Distance |
ADR (Week/Weekend) |
Occupancy |
Cleaning Fee |
Min Stay |
Notes |
|
3 |
Hot tub, parking, pet-friendly |
0.4 mi |
$185/$225 |
68% |
$150 |
2 nights |
Near convention center |
|
3 |
Pool, washer/dryer, workspace |
0.9 mi |
$200/$240 |
63% |
$165 |
3 nights |
Premium finishes |
|
2 |
Patio, no parking |
0.3 mi |
$150/$175 |
72% |
$120 |
2 nights |
Budget option; strong occupancy |
List Every Startup and Recurring Expense
Comprehensive expense tracking is crucial for accurate profitability analysis. Many investors underestimate the total cost of STR operations by 30-50%, leading to disappointing returns and cash flow problems.
The difference between projected and actual profitability often comes down to expenses you didn't anticipate or significantly underestimated. Insurance costs 2-3 times higher than standard homeowner policies, cleaning expenses that scale with bookings, and platform fees that consume 3-5% of revenue add up quickly.
Initial Setup Costs
Down Payment and Closing Costs: Upfront acquisition capital typically 15-25% of purchase price plus 2-4% in lender fees, title insurance, and closing expenses.
Furnishings and Decor: Beds, mattresses, sofas, dining sets, artwork, linens, towels, kitchenware—budget $15,000-35,000 depending on property size and quality level.
Appliances and Smart Tech: Washer/dryer, dishwasher, smart locks, thermostats, noise monitors, security cameras—typically $5,000-12,000.
Renovations and Safety: Paint, flooring, egress windows, smoke detectors, CO detectors, fire extinguishers, first aid kits—varies widely but budget $10,000-50,000 for conversion properties.
First-time investors often underestimate furnishing costs by focusing only on major pieces while forgetting the dozens of small items guests expect: coffee makers, wine glasses, cutting boards, throw pillows, hangers, toilet paper holders.
Monthly Operating Expenses
Mortgage Principal and Interest: Monthly loan payments based on your financing terms and down payment amount.
Property Taxes and STR Licensing: Annual taxes divided by 12, plus local permit fees and business license costs amortized monthly.
Insurance (STR-Specific): Short-term rental or commercial policy with liability coverage—typically $150-300 monthly, 2-3x standard homeowner rates.
Utilities: Electricity, gas, water/sewer, trash, internet, streaming services—budget $250-500 monthly depending on property size and location.
Many investors mistakenly budget standard homeowner insurance rates, only to discover their policy excludes short-term rental activity. STR-specific insurance policies cost significantly more but provide essential liability protection.
Per-Stay and Variable Costs
Cleaning costs scale directly with bookings, creating variable expense patterns that differ from traditional rentals. A property with 20 bookings monthly spends $1,600-4,000 on cleaning alone.
-
Cleaning and laundry: Turnover labor $80-200 per cleaning, linen service if outsourced, consumable supplies
-
Restocking: Toiletries, coffee/tea, paper goods, light bulbs, batteries, kitchen consumables—typically $15-30 per turnover
-
Platform fees: Airbnb/OTA host fees typically 3% of booking value plus payment processing fees
-
Software and tools: Property management systems, dynamic pricing tools, channel managers—typically $50-150 monthly combined
Ongoing Maintenance and Reserves
Capital expenditure reserves separate successful long-term investors from those who face cash flow crises when major systems fail. Your HVAC system will eventually need replacement, furniture wears out after 3-5 years of heavy guest use, and roofs don't last forever.
-
Repairs and maintenance: Handyman services, appliance repairs, HVAC service contracts, plumbing issues—budget $150-300 monthly
-
Landscaping/snow removal: Exterior maintenance varies by season and climate—$100-400 monthly
-
Management or co-host: 15-30% of gross revenue if outsourcing operations, typically 20-25% for full-service management
-
Reserve/CapEx: Budget for major replacements—typically $200-400 monthly set aside
|
Expense Category |
Amount |
Notes |
|
Mortgage P&I |
$1,900 |
Based on $300K purchase, 20% down |
|
Property Taxes/Insurance |
$450 |
Includes STR-specific coverage |
|
Utilities/Internet |
$350 |
All-inclusive guest experience |
|
Platform/Software Fees |
$186 |
3% Airbnb fees + $60 PMS/pricing |
|
Cleaning/Supplies |
$200 |
$120 cleaning + $80 restocking |
|
Maintenance/Reserves |
$350 |
$150 repairs + $200 CapEx reserve |
|
Total Fixed Costs |
$3,436 |
Before management fees |
Calculate Net Income and Cash-on-Cash Return
Use Rabbu's Investor Return Calculator to determine actual profitability using key real estate investment metrics that account for financing, expenses, and tax benefits. Raw revenue numbers mean nothing without understanding your true returns after all costs.
Cash-on-cash return measures the annual pre-tax cash flow you receive as a percentage of the total cash invested upfront. A property generating $18,000 annual cash flow on a $60,000 investment delivers a 30% cash-on-cash return, while the same cash flow on a $90,000 investment only yields 20%.
Use Rabbu's Integrated Return Calculator
The Investor Return Calculator can be found on the property detail page for every active listing in Rabbu’s marketplace as well as on the Airbnb Calculator (which works for any address in the US whether actively listed or not).
Enter your purchase price in the calculator below the revenue projection, along with estimated down payment percentage and interest rate. Add all estimated expenses including mortgage, property taxes, insurance, utilities, platform fees, cleaning, supplies, and management fees if outsourcing operations.
Review Cap Rate (Net Operating Income divided by property value), ROI (total return including appreciation), and cash-on-cash returns for property comparison. The calculator automatically factors in typical STR expense ratios, but you can adjust individual line items based on your specific property and market conditions. Here are all the inputs that can be adjusted:
-
Total investment: Totals the purchase price, closing costs, immediate repairs, furnishing costs, and initial expenses.
-
Expenses: Totals the channel fee, property management fee, supply fees, property taxes, insurance, HOA fees, utilities, maintenance, and other expenses.
-
Financing: Takes into account down payment, loan closing costs, interest rate, interest type, and amortization term.
All of this information will help you determine if your Airbnb will be profitable before even making an offer.
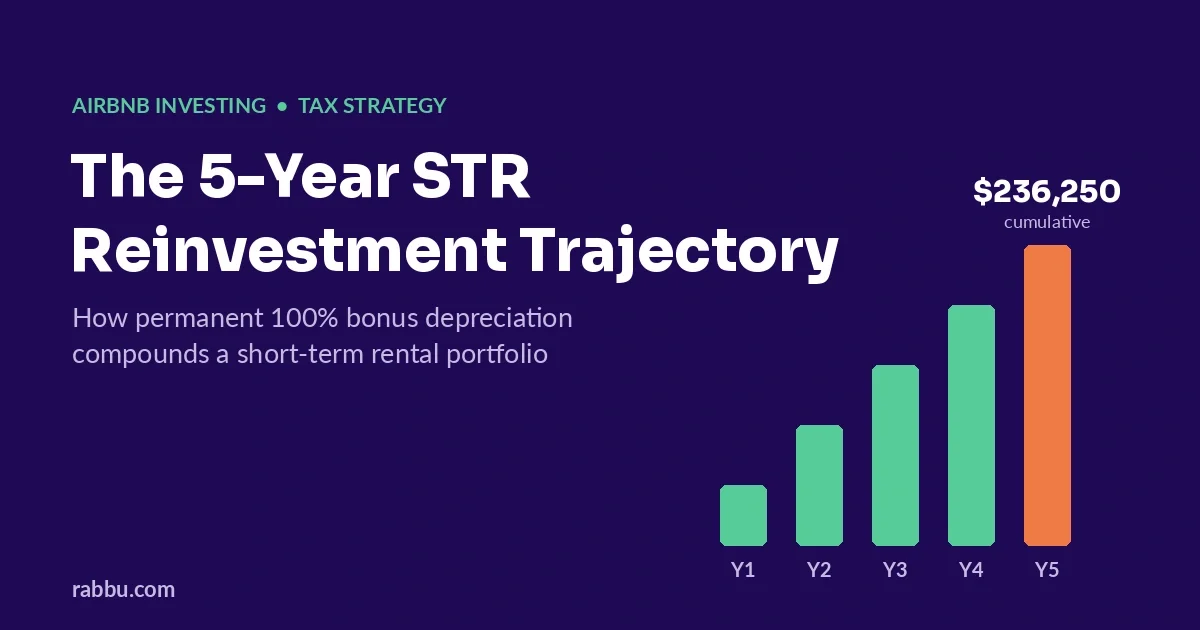
Include Tax Benefits and Depreciation
STR properties qualify for accelerated depreciation and bonus depreciation under current tax law. You can depreciate the building portion of your purchase over 27.5 years, while furnishings and improvements can be depreciated over much shorter periods.
Bonus depreciation allows you to deduct 60% of qualifying property costs in year one (as of 2024, phasing down annually). A $300,000 property with $30,000 in furnishings might generate $20,000+ in first-year depreciation deductions. Consult with STR-specialized CPAs about material participation status—investors who qualify as real estate professionals can use STR losses to offset W-2 income.
Benchmark Against Long-Term Rental Returns
Compare STR returns to traditional rental income in the same market to validate whether the additional complexity and management burden justify the revenue premium. If your projected STR generates $4,200 monthly but a long-term rental would produce $2,800 with dramatically less operational involvement, the $1,400 monthly premium might not justify the effort depending on your goals.
|
Metric |
Amount |
Notes |
|
Gross Revenue (ADR $200 x 70% occ x 30 nights) |
$4,200 |
Based on market comps |
|
Platform Fees (3%) |
-$126 |
Airbnb host fees |
|
Management (20%) |
-$840 |
Professional management |
|
Fixed Operating Expenses |
-$2,596 |
Mortgage, taxes, utilities |
|
Variable Expenses |
-$200 |
Cleaning, supplies, maintenance |
|
Net Operating Cash Flow |
$438 |
With professional management |
|
Self-Managed Scenario |
$1,278 |
Remove 20% management fee |
|
Annualized Cash Flow (self-manage) |
$15,336 |
Monthly x 12 |
|
Cash-on-Cash Return (on $60K invested) |
25.6% |
Strong STR market performance |
Stress-Test Profitability With Worst-Case Scenarios
Conservative projections help ensure your investment remains viable during market downturns, regulatory changes, or competitive pressures. Markets change, regulations evolve, and competition increases—projections based solely on current conditions without stress-testing leave you vulnerable.
Properties that barely cash flow under optimistic assumptions become money-losing liabilities when occupancy drops or expenses increase.
Model Revenue Decline Scenarios
Drop ADR by 20% to test the impact of increased competition as more investors enter your market or economic conditions reduce travel spending. If your property still cash flows with rates at $160 instead of $200, you have meaningful downside protection.
Reduce occupancy to 50% to model performance during economic downturns, off-seasons, or periods when you need to take the property offline for major maintenance. Properties dependent on 70%+ occupancy to break even face serious risk during inevitable slow periods.
Combine both factors to see true worst-case performance. A property that remains cash flow positive even with 50% occupancy and 20% lower rates demonstrates resilience across market conditions.
Factor in Unexpected Capital Expenses
Add $500-1,000 monthly for major repairs, furniture replacement, or compliance costs that inevitably arise. HVAC systems fail, roofs leak, hot tubs break, and furnishings wear out faster than expected under commercial hospitality use.
Model the impact of new regulatory requirements like permit fees, inspection costs, or occupancy taxes that many markets have implemented in recent years. Re-calculate debt service coverage ratio to ensure mortgage serviceability under stressed scenarios—lenders typically require 1.2-1.25 DSCR, but aiming for 1.4+ provides cushion when revenue underperforms projections.
Test Alternative Revenue Strategies
Model mid-term rental rates for 30+ day stays as a fallback option during slow periods or if STR regulations tighten. Many STR properties can pivot to traveling nurses, corporate relocations, or seasonal workers at lower rates but with dramatically reduced operational complexity.
Calculate traditional long-term rental income as a worst-case scenario to understand your absolute downside protection. Assess break-even occupancy rates and minimum viable ADR thresholds so you understand exactly how much performance can decline before you're losing money.
|
Scenario |
Monthly Cash Flow |
Annual Return |
Viability |
|
Base Case (70% occ, $200 ADR) |
$1,278 |
25.6% |
Strong |
|
Conservative (60% occ, $180 ADR) |
$624 |
12.5% |
Acceptable |
|
Stressed (50% occ, $160 ADR) |
-$132 |
-2.6% |
Requires pivot |
|
Long-term rental fallback |
$456 |
9.1% |
Viable exit strategy |
Factor In Regulations, Taxes, and Financing Rules
Legal compliance and tax implications significantly affect STR investment viability and long-term profitability. Properties that appear profitable on paper can become money-losing liabilities if you discover post-purchase that STR operations aren't permitted or require expensive compliance measures.
Regulatory landscapes vary dramatically between jurisdictions—some cities welcome STR investments with minimal restrictions while others impose permit caps, occupancy limits, or outright bans.
Key Regulatory Questions to Research
Are STRs permitted by right, conditionally allowed with special permits, or prohibited in your target property's zoning district? Is there a cap on the total number of STR permits issued, creating artificial scarcity and waiting lists?
What are maximum guest limits, parking requirements, and noise ordinances that might limit your property's appeal? What local tourism taxes, occupancy taxes, or business license fees apply, and who's responsible for collection and remittance?
What inspection requirements, fire safety equipment, and accessibility standards are required before operating legally? Are there deed restrictions, condo association rules, or neighborhood covenants that prohibit or limit short-term rentals? What are typical fines for violations, how aggressive is local enforcement, and what are the consequences of non-compliance?
Explore STR-Specific Financing Options
Traditional mortgages don't recognize projected STR income for qualification purposes, forcing you to qualify based solely on W-2 earnings regardless of the property's cash flow potential. DSCR (Debt Service Coverage Ratio) loans qualify you based on the property's projected income rather than your personal finances.
Rabbu's lending partners specialize in STR financing with faster closings, lower down payments, and underwriting standards designed specifically for investment properties.
DSCR Loan Advantages:
-
Cash Flow-Based Underwriting: Qualify based on property income projections rather than personal W-2 earnings or tax returns
-
Lower Down Payments: Often 15-25% versus 25-30% for traditional investment loans
-
Faster Closings: Streamlined process typically closes in 21-30 days instead of 45-60
-
Flexible Property Types: Accommodate unique STR properties and mixed-use buildings conventional lenders reject
Self-employed investors, portfolio builders who've maxed out conventional loan limits, and anyone tired of traditional bank bureaucracy benefit most from DSCR financing.
Find a Lender that Specializes in Short-Term Rentals
Connect with lenders who actually understand short-term rental cash flow and offer DSCR loans, portfolio financing, and investor-friendly terms.
Get Matched with STR LendersDecide Between Self-Managing or Hiring a Co-Host
Management choice directly impacts profitability, time investment, and scalability potential. The difference between self-managing and hiring professional management can swing annual returns by 15-30 percentage points—but returns come at the cost of significant time and operational involvement.
Your management decision depends on proximity to the property, available time, operational expertise, and long-term portfolio goals.
Self-Management: Maximum Profit, Maximum Involvement
Self-managing eliminates 15-30% management fees, typically saving $600-1,500+ monthly on a well-performing property. Savings flow directly to your bottom line, dramatically improving cash-on-cash returns.
You maintain direct control over guest experience, property standards, and operational decisions that impact reviews and repeat bookings. Learn STR operations firsthand, building expertise that compounds as you scale. Respond faster to guest issues and questions, often improving satisfaction scores and review quality.
However, expect significant daily time commitment for guest communication, booking management, and operational coordination—typically 5-15 hours weekly per property. You face 24/7 availability requirements for guest emergencies and unexpected issues. The learning curve for dynamic pricing, revenue management, and operational efficiency is steep. Difficulty scaling beyond 2-3 properties without implementing robust systems becomes a constraint.
Self-management works best for investors who live near their properties, enjoy hospitality operations, have flexible schedules, and prioritize profit maximization over passive income.
Professional Management: Passive Income, Reduced Returns
Professional management companies handle all guest communication, cleaning coordination, maintenance issues, and operational details in exchange for 15-30% of gross revenue. You own the asset and receive monthly distributions without day-to-day involvement.
Passive ownership requires minimal daily involvement beyond reviewing monthly financial statements. Professional systems for cleaning, maintenance, and guest communication are based on managing dozens or hundreds of properties. Higher guest satisfaction and review scores in many cases result from 24/7 professional support. Easier scaling for multi-property portfolios since management complexity doesn't compound with each additional acquisition.
Management fees typically consume 15-30% of gross revenue, reducing annual cash flow by $7,000-18,000+ on well-performing properties. You have less direct control over guest experience and operational decisions. Potential for lower revenue optimization compared to highly engaged owner-operators exists. Additional coordination is required for major decisions or property improvements.
Professional management suits investors building larger portfolios, those living far from their properties, busy professionals who value time over maximum returns, and anyone preferring truly passive real estate investments.
Hybrid Approach: Balanced Control and Efficiency
Many successful investors adopt hybrid models that balance profit optimization with reduced time commitment. Handle guest communication, booking management, and pricing strategy personally to maintain control over revenue optimization. Outsource cleaning, maintenance coordination, and restocking to local providers at fixed per-service rates rather than percentage-based management fees.
Use property management software for automation and efficiency—automated messaging, smart locks for self-check-in, digital guidebooks. This approach often delivers 80% of self-management profits with 40% of the time commitment.
Find STR-Friendly Listings and Lenders Through Rabbu's Platform
Traditional real estate platforms lack STR-specific data, expertise, and service provider networks that short-term rental investors require. Rabbu's marketplace provides the first platform designed specifically for STR investors, combining property discovery, income analysis, and specialized service provider connections in one integrated ecosystem.
View exclusive listings not found on traditional MLS or real estate platforms. Filter for “Active Airbnb” (turnkey properties) or “Airbnb Potential” (conversion opportunities). Get instant access to market data, ROI calculations, and regulatory compliance status.
Connect with STR-specialized buyer agents through Rabbu's Find an Agent tool. Work with agents who understand STR market dynamics, regulations, and cash flow analysis. Access exclusive listings and off-market opportunities through STR-focused networks. Negotiate based on income potential rather than just comparable sales.
Secure STR-friendly financing by connecting with DSCR lenders through Rabbu's Find a Lender tool. Qualify based on property cash flow rather than personal income. Access faster closings and more flexible underwriting standards. Work with lenders experienced in STR seasonal cash flow patterns.
Frequently Asked Questions About Airbnb Profitability
What's a good ROI for an Airbnb investment?
A good Airbnb ROI typically ranges from 8-12% annually, though top-performing properties in strong markets can achieve 15-20%+ cash-on-cash returns. Compare this to traditional long-term rentals, which usually generate 4-8% returns. Your target ROI should factor in your market, property type, and investment goals. Properties with proven track records—like those sold as turnkey Airbnbs—often provide more predictable returns than starting from scratch.
How do I calculate if an Airbnb will be profitable before buying?
Use Rabbu’s Investment Return Calculator which can be found on every active listing in Rabbu’s marketplace as well as on the Airbnb Calculator (which works for any address in the US whether actively listed or not). Your net operating income should exceed your debt service by at least 20-30% to provide a comfortable cash flow buffer. Always build in a 10-15% expense buffer for unexpected costs.
What occupancy rate do I need to break even on an Airbnb?
Most Airbnb investors need 50-65% occupancy to break even, depending on their expenses and nightly rates. However, breakeven isn't your goal—you should target 65-75% occupancy for healthy profitability. Markets with strong year-round demand make it easier to maintain consistent occupancy, while seasonal markets may see 80%+ occupancy during peak months but drop to 30-40% in off-season. Calculate your specific breakeven point by dividing your total monthly expenses by your average daily rate.
Is it better to buy an existing Airbnb or start a new one?
Buying an existing Airbnb significantly reduces risk because you can see proven revenue history, inherited reviews, and established operational systems. You'll know exactly what the property earns rather than relying on projections, and you can often negotiate based on actual performance data. Starting from scratch gives you more control over design and pricing but requires 6-12 months to build reviews and optimize operations. For first-time investors, buying existing properties with verified income offers the fastest path to profitability.
How much money do I need to start an Airbnb investment?
Plan for at least $50,000-75,000 for a traditional purchase (15-25% down payment plus closing costs, furnishing, and reserves), though this varies widely by market. Some investors start with as little as $25,000 using rental arbitrage (leasing and subletting), while luxury properties may require $150,000+ in capital. DSCR loans allow you to qualify based on the property's income rather than personal income, making it easier for investors to scale. Always maintain 6 months of expense reserves for vacancies and unexpected costs.
Don't Let Financing Kill Your Deal
Most banks don't understand short-term rentals. These lenders do.
Find a Lender