Free Airbnb Data, Statistics & Market Analysis for Short-Term Rental Investors
Access comprehensive Airbnb analytics, vacation rental statistics, and ROI projections for 3,500+ U.S. cities. Real-time data updated weekly from 1.1M+ active listings.
Trusted by
200,000+ investors
for data-driven short-term rental investment decisions
Jul 2026 Airbnb Statistics & Short-Term Rental Market Data For Real Estate Investors
Real-time Airbnb market data, vacation rental statistics, and STR insights from the United States short-term rental market.
How to Get Free Airbnb Data & Research Any Market For Airbnb Potential
Use Rabbu to access free Airbnb data, research any short-term rental market, and analyze key Airbnb statistics to find the best places to invest.
Start with Rabbu
Search any market on Rabbu to pull Airbnb insights, review short-term rental activity, and start your investment research.
Compare Top Markets
Analyze revenue potential, occupancy rates, seasonality, and other short-term rental metrics to evaluate each market.
Connect with Experts
Once you've found a market you like, connect with local experts on Rabbu who can help you find and buy the right STR property.
Key Airbnb Metrics Every Short-Term Rental Investor Should Understand
Airbnb market analysis starts with a few core short-term rental metrics. These Airbnb analytics help investors compare markets, estimate revenue, evaluate demand, and identify the best places to buy an Airbnb investment property.
Occupancy Rate
Occupancy rate measures the percentage of nights a short-term rental is booked over a given period. For Airbnb investors, occupancy is one of the clearest indicators of market demand because it shows how often properties are likely to generate income. Higher occupancy rates generally support stronger cash flow, while lower occupancy can signal weaker demand, oversupply, or heavier seasonality.
Average Daily Rate (ADR)
Average Daily Rate (ADR) is the average nightly price a property earns on booked nights. This metric helps investors understand pricing power in a market and estimate how much revenue a listing can produce. A market with a strong ADR can be attractive, but investors should always compare ADR alongside occupancy, property prices, and operating costs to understand true investment potential.
Revenue Per Available Night (RevPAN)
Revenue Per Available Night (RevPAN) combines occupancy rate and ADR into one performance metric. It shows how much revenue a property generates for each night it is available, not just the nights it is booked. Because RevPAN reflects both demand and pricing, it is one of the most useful Airbnb metrics for comparing markets, property types, and overall earning potential.
Gross Yield
Gross yield measures the annual revenue a short-term rental property generates relative to its purchase price. For Airbnb investors, it is a useful way to compare markets and quickly evaluate income potential before factoring in expenses. Higher gross yield markets can indicate stronger top-line return potential, especially when paired with healthy occupancy rates, solid ADR, and manageable operating costs.
ROI Score
ROI Score is a summary metric that helps investors quickly compare Airbnb markets based on revenue potential, pricing, demand, and other short-term rental fundamentals. Instead of reviewing every data point individually, investors can use ROI Score as a fast way to identify markets with stronger overall investment potential. It is best used as a screening tool alongside detailed market-level analysis.
"Short-term rentals continued to capture market share from hotels in 2025—STR demand increased 6.0%, well above the 0.3% contraction in traditional hotel demand, with STR share of total demand reaching 13.9%."
Latest Airbnb Market Insights & Statistics
Explore the latest Airbnb data, short-term rental statistics, and vacation rental market trends shaping investor decisions.
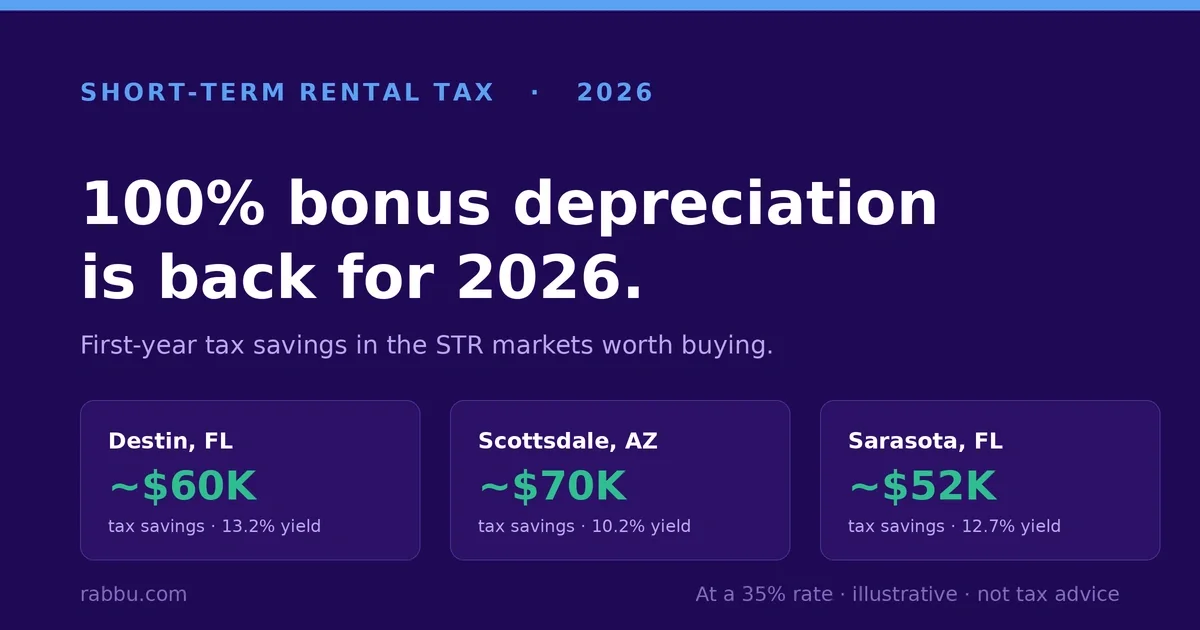
The Best Short-Term Rental Markets for Bonus Depreciation in 2026
With 100% bonus depreciation back for 2026, see the first-year tax savings a short-term rental can generate in 12 strong, liquid markets, with median prices, yields, and listings for each.

Emir Dukic
CEO @ Rabbu.com
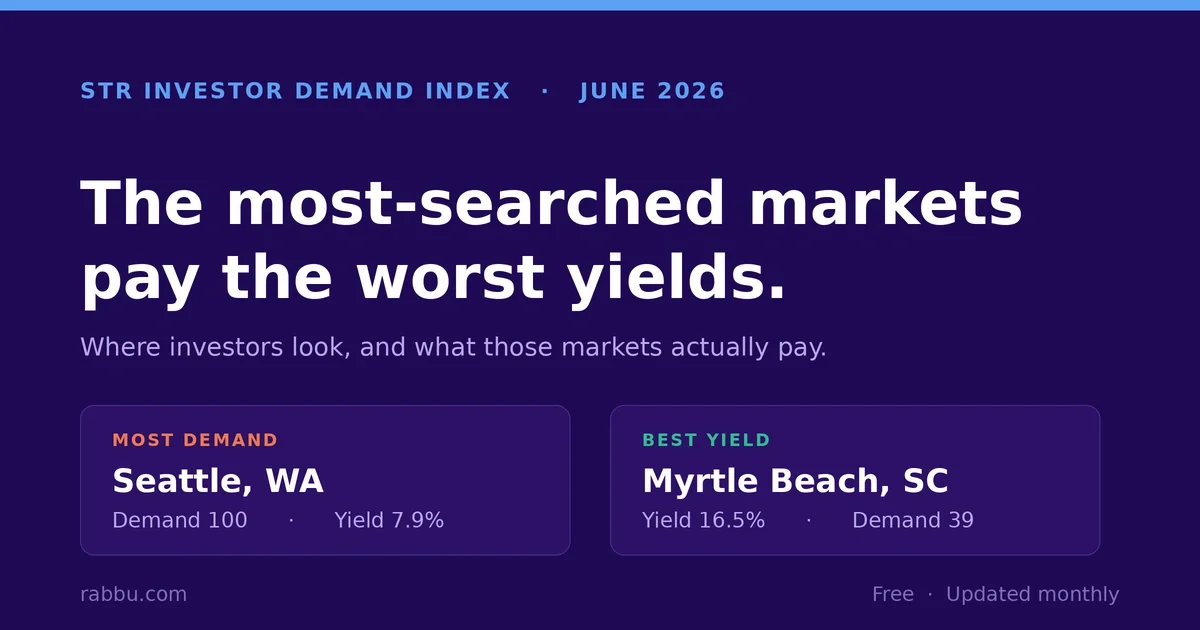
Rabbu's STR Investor Demand Index: Where Short-Term Rental Investors Are Looking (June 2026)
The June 2026 STR Investor Demand Index ranks the U.S. short-term rental markets that investors search most, and the gross yields those markets actually deliver.
Emir Dukic
CEO @ Rabbu.com
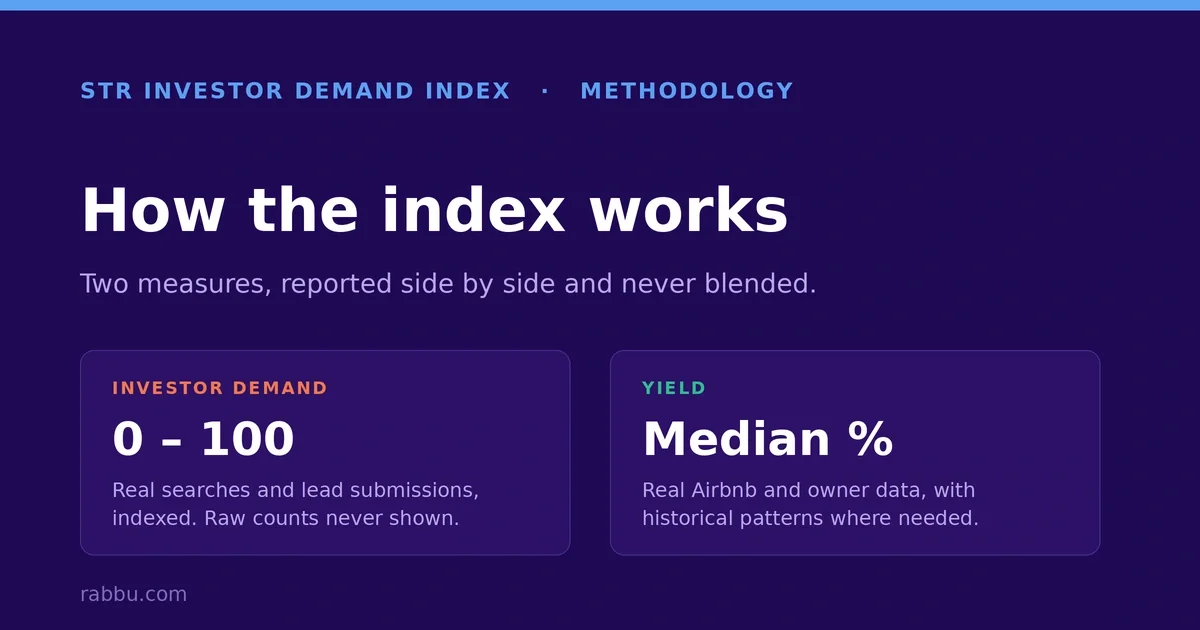
How Rabbu's STR Investor Demand Index Works
How the Rabbu Demand Index measures short-term rental investor demand and market yield, where the data comes from, and what the numbers do and do not promise.
Emir Dukic
CEO @ Rabbu.com
Who Uses Airbnb Data & Analytics?
Rabbu's Airbnb data and short-term rental analytics help investors, agents, and lenders research markets, evaluate Airbnb investment opportunities, and make more informed real estate decisions.
Real Estate Investors
Real estate investors use Airbnb data to compare markets, estimate revenue potential, evaluate ROI, and identify short-term rental properties with strong income potential before they buy.
Real Estate Agents
Real estate agents use Airbnb market data to help clients understand short-term rental potential, identify investable markets, and support smarter property searches with data-backed insights.
Lenders & Brokerages
Lenders and brokerages use Airbnb analytics to assess borrower opportunity, understand market performance, and better support financing decisions for short-term rental investment properties.
Frequently Asked Questions About Airbnb Data
- What is Airbnb data and how can it help investors?
- Airbnb data is market-level statistics and analytics for short-term rentals: occupancy rates, average daily rates (ADR), revenue per available night (RevPAR/RevPAN), supply growth, and seasonal trends. It helps investors spot strong markets, estimate income potential, and avoid overbuilt or regulated areas. Industry research and case studies show that investors who use market data before buying tend to make better decisions—for example, identifying deals that would underperform or walking away from risky markets—compared to those who rely on intuition alone.
- How accurate is Rabbu's Airbnb market data?
- Rabbu's market data comes from multiple sources, including live Airbnb and short-term rental listings, historical performance data, and real estate indicators. Our revenue estimates are designed to reflect typical market performance; we update data regularly so it stays in line with current demand and seasonality. Third-party providers like AirDNA have had their methodology validated against platform performance in the past, and we apply similar rigor to sourcing and presenting our metrics so you can research markets with confidence.
- What Airbnb statistics are most important for market analysis?
- The most useful statistics are: occupancy rate (U.S. average is roughly 50–54%), average daily rate (ADR), revenue per available night (RevPAR or RevPAN), seasonal demand patterns, year-over-year supply growth, and local regulations. Markets with occupancy at or above 55% are often considered solid; those with very high supply growth or strict STR rules can be riskier. Combining occupancy, ADR, and supply trends gives you a clearer picture of where a market stands and whether it fits your strategy.
- How does Rabbu compare to AirDNA for Airbnb data?
- Rabbu gives you free access to core Airbnb and short-term rental market data and ROI-style metrics so you can compare markets and ballpark returns. Paid platforms like AirDNA offer additional depth (e.g., longer history, listing-level data, dynamic pricing tools) with subscription plans that start around $34/month (Pro) or $125/month (Advanced). If you want to screen markets and understand basics like occupancy and revenue potential without a subscription, Rabbu’s free tools and ROI scoring are a good starting point before you commit to paid analytics.
- What is the average Airbnb occupancy rate in the US?
- The U.S. average short-term rental occupancy rate is about 50–54% as of 2025, down from roughly 57% in 2024 as supply has grown. Performance varies a lot by market: some secondary or well-positioned markets can reach the high 70s or 80s, while oversupplied or heavily regulated areas can sit in the 30s. Analysts often treat 55% or higher as strong performance. Average daily rates have remained firm, and revenue per available rental has continued to grow in many markets despite the occupancy dip, so it’s important to look at both occupancy and rate together.
- How do I research an Airbnb market before investing?
- Start by reviewing occupancy and revenue trends with a tool like Rabbu, then compare supply growth—markets where listings are growing much faster than demand can get more competitive. Check local short-term rental rules (bans, caps, permits, taxes). Estimate expenses realistically: operating costs often run 30–50% of gross revenue depending on management and location, so use 25–35% only if you’re confident in lower-cost operations. Finally, look at seasonality and competitive set. Rabbu’s free market data lets you do this for hundreds of U.S. markets by city, county, or ZIP before you dig deeper elsewhere.
- Can I get Airbnb analytics for specific cities?
- Yes. Rabbu provides Airbnb and short-term rental analytics for many U.S. markets—you can look up by city, county, or ZIP code. You’ll see metrics such as typical revenue by property type, occupancy trends, and how a market stacks up for investment. Use this to narrow down cities or neighborhoods, then layer in local regulations and your own expense assumptions to decide where to invest.
- How do you calculate Airbnb ROI?
- ROI is typically: (Annual Net Operating Income ÷ Total Investment) × 100. Net operating income is gross rental revenue minus operating expenses (management, cleaning, utilities, maintenance, taxes, insurance, etc.). Short-term rental operating expenses often run 30–50% of gross revenue depending on whether you self-manage or use a manager; 25–35% is possible in lower-cost setups. Rabbu’s ROI-style metrics use local market data (occupancy, ADR, and revenue estimates) and common expense assumptions so you can compare markets and ballpark returns before modeling your own numbers in detail.
Start Analyzing Top Airbnb Markets Today
Research top short-term rental markets across the U.S. with Airbnb data, including market trends, performance insights, and investor-focused analytics.
